Visualizing data is a fantastic way to gain insights into a specific domain. In some contexts, it would be beneficial to be able to generate a graph programmatically.
Graphviz
Graphviz is a graph visualization tool (I bet you wouldn’t have guessed that, would you?). It reads a textual description of a graph written in its Domain Specific Language, called DOT, and is capable of producing various output formats, including images.
The fact that it reads from a simple text file (or from stdin) opens the door
for all sorts of integrations and automations.
Some relevant use cases can be found in the description of the debian graphviz package.
Automatic generation of graph drawings has important applications in key
technologies such as database design, software engineering, VLSI and
network design and visual interfaces in other domains. Situations where
these tools might be particularly useful include:
.
* you would like to restructure a program and first need to understand
the relationships between its types, procedures, and source files
* you need to find the bottlenecks in an Internet backbone - not only
individual links, but their relationships
* you're debugging a protocol or microarchitecture represented as a
finite state machine and need to figure out how a certain
error state arises
* you would like to browse a database schema, knowledge base, or
distributed program represented graphically
* you would like to see an overview of a collection of linked documents
* you would like to discover patterns and communities of interest in a
database of telephone calls or e-mail messages
You can install Graphviz on Debian-based distributions with apt install graphviz.
DOT
At its core, the DOT format allows you to specify node and edge definitions. Let’s see a simple example.
graph {
    "node-a-id" [label="Node A Label"]      // Node A properties
    "node-a-id" -- "node-b-id"              // Node A - Node B edge
}
Node B does not have any properties specified, but it is mentioned as the end of an edge.
Using the dotty interactive graph editor (part of graphviz) we can visualize
the results and experiment with them. If called as dotty -, it reads from stdin
for a DOT specification.
echo 'graph {
    "node-a-id" [label="Node A Label"]
    "node-a-id" -- "node-b-id"
}' | dotty -
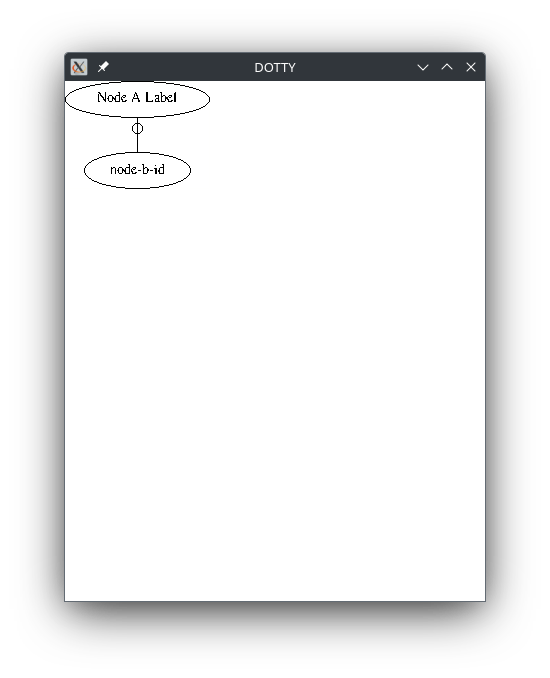
As we can see, Node B is displayed using its ID, as it does not have a label.
The output may be a bit rough, but dotty is a powerful tool for experimenting with Graphviz.
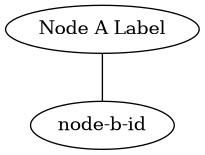
We can generate a better-looking graph using dot.
echo 'graph {
    "node-a-id" [label="Node A Label"]
    "node-a-id" -- "node-b-id"
}' | dot -Tpng -o graph.png
Example
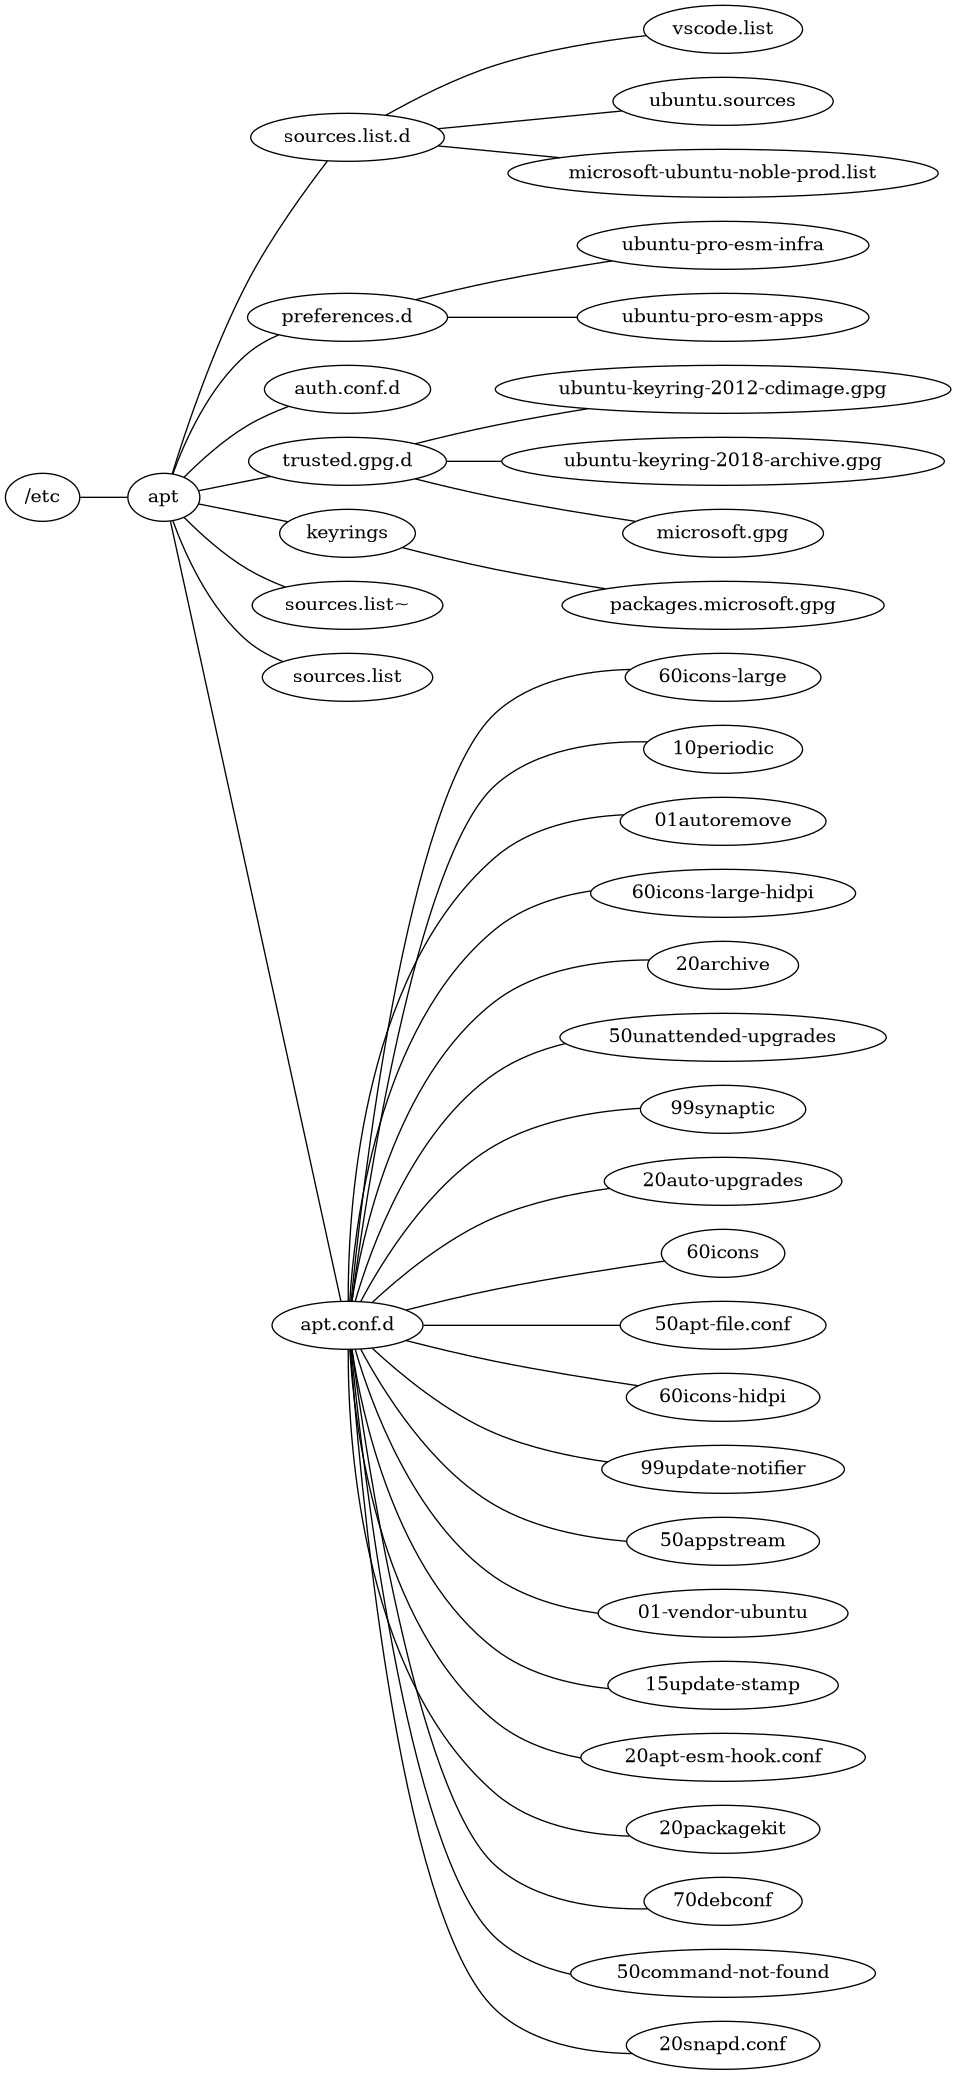
Let’s see a simple example: we want to visualize a directory subtree to get an
idea of its content. Let’s take into account /etc/apt directory (and let’s
pretend that the program tree does not exist).
(
    echo "graph {"

    echo "rankdir=RL"

    find /etc/apt -printf '%p\t%h\t%f\n' | awk -F '\t' '{
        printf "\"%s\" [label=\"%s\"]\n", $1, $3;
        printf "\"%s\" -- \"%s\"\n", $1, $2;
    }'

    echo "}"
) | dot -Tpng -o graph.png
Here’s the result on my system:
Let’s analyze each command one by one:
echo "graph {"
echo "rankdir=RL"
...
echo "}"
These istructions print the configuration for opening and closing the graph object and setting the proper direction of graph layout, so that files (leafs) are on the right.
find /etc/apt -printf '%p\t%h\t%f\n'
find scans the directory subtree of /etc/apt and prints for each file:
- The full path
- The base directory path
- The file name
These are separated using a tab character (\t).
awk -F '\t' '{
    printf "\"%s\" [label=\"%s\"]\n", $1, $3;
    printf "\"%s\" -- \"%s\"\n", $1, $2;
}'
We use full paths as node IDs and the file name as labels. The edge links a file (or directory) with its parent directory.
awk is used to parse the output of find. It reads from stdin and for each line
it prints two lines:
- A node definition:
"<full-path>" [label="<file name>"] - An edge definition:
"<full-path>" -- "<base-directory-path>"
We use full paths as node IDs and file name as labels. The edge links a file (or directory) with its parent directory.
Conclusions
We just saw a very simple example of what Graphviz is capable of, but it can be used to generate all kinds of arbitrarily complex graphs, as it supports a wide range of configuration options. Its versatility allows users to create detailed visual representations tailored to specific needs, making it an invaluable tool for various applications.
Besides its CLI interface, bindings for different programming languages are available.
Think about it next time you need a graph representation of something.